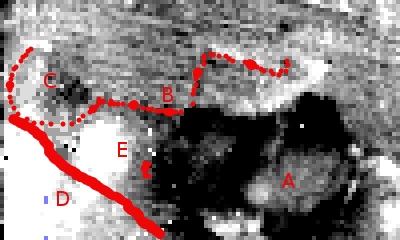
Fig 2: High contrast plot of resistivity survey (north roughly to top)
Your email address will not be published. Required fields are marked *
Comment *
Name *
Email *
Website
Save my name, email, and website in this browser for the next time I comment.
Δ